LPT Blog – Exam Tips, College Guides
LPT Blog helps you with CAT, IPMAT, CUET, BBA, and MBA preparation through expert tips, college insights, free resources, and success stories.
 27 Jun 2026
 11 Jun 2026
Trending Now
- CUET Eligibility Criteria 2026, Age, Marks, Rules and Guidelines
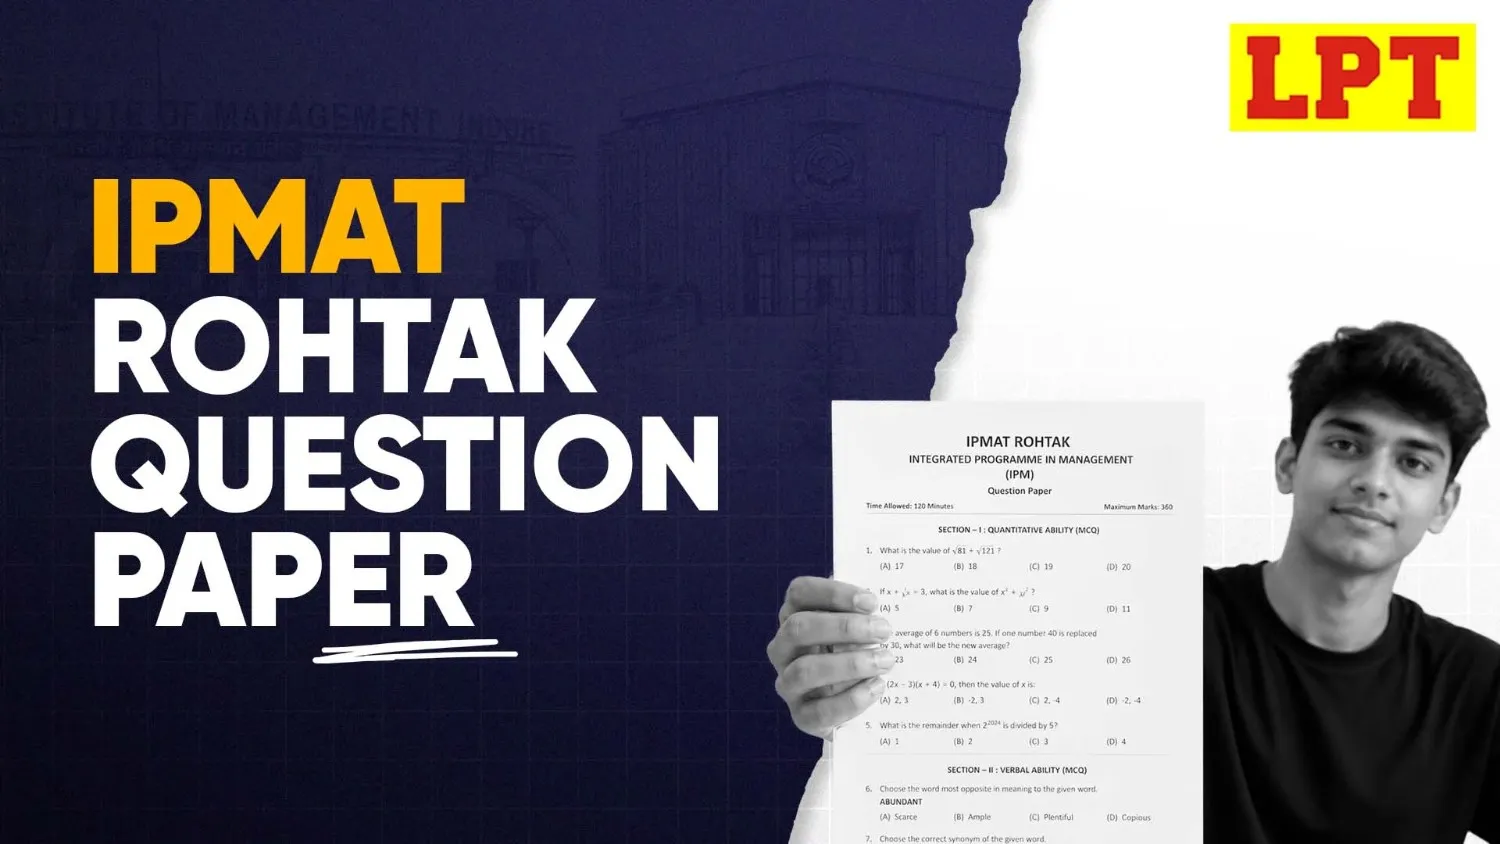
- IPMAT Rohtak Previous Year Papers (PYQs): Download PDF
- NPAT Result 2026 Released @npat.nmims.edu, Download Offer Letter
- NMIMS NPAT Exam Date 2026: Registration and Important Dates
- IPMAT Indore Admit Card 2026 (Released): Direct Download Link
- IPMAT Indore Exam Date 2026: Full Schedule & Result Date
- IPMAT Indore Cut off 2026 (OUT): Category-Wise Marks Required
- IPMAT Indore Registration 2026, Dates, Process and Details
Essential Reads
- 10 Best CUET Colleges in Rajasthan (2026-27 List)
- 8 Best CUET Colleges in Jaipur (2026-27 List)
- Top 5 CUET Colleges in West Bengal 2026, Courses & List
- 7 Best BTech CUET Colleges in Rajasthan (2026-27 List)
- 10 Best CUET Colleges in Maharashtra for 2026 Admission
- 8 Best CUET Colleges in Bangalore (2026-27) Complete List
IPMAT Rohtak
IPMAT Indore
Have Questions? Talk to Our Counsellor!
Whether it’s about scholarships, coaching, or exam strategies, we’re here to guide you.

Management UG
Management PG
Other
Book Free Counselling For CLAT 2028 Preparation!
Register now and get expert guidance for free
Have Questions? Talk to Our Counsellor!
Whether it’s about scholarships, coaching, or exam strategies, we’re here to guide you.